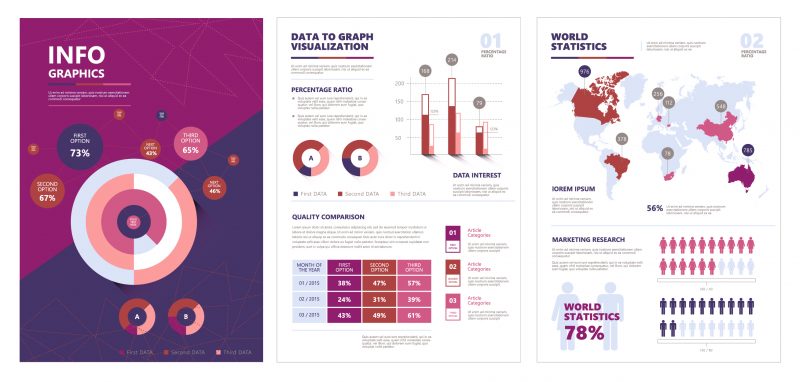
A picture is indeed worth a thousand words, and a thousand pieces of data can be summarized with an intelligent, well-designed infographic. Maps, drawings, pictures, charts, and graphs have long helped humans understand concepts and data – and this is the foundation of data visualization. But serious challenges have arisen in recent years, as computers and other screens have become an integral part of a business and everyday life. Moreover, with digital life has come an overwhelming influx of data to manage and interpret. The data can be revealing and enlightening, but the challenge is to present complex information in a clear and understandable way in the digital age of visual learners.
A well-known theory that came into vogue in the last century claimed individuals could be classified as visual, aural, or kinesthetic learners. To communicate most effectively, one had to adopt one’s messages accordingly. A recent study found that more than 65% of humanity are visual learners. In fact, everyone is a visual learner to some extent, and increasingly so. The human brain devotes far more neurons to visual processing than to aural or kinesthetic stimuli.

Why Use Data Visualization?
Simply put, data visualization presents data pictorially or graphically so that people can quickly comprehend it. Without astute data visualization techniques, organizations cannot stay on top of the rising tide of never-ending data, reports, studies, training, let alone use their insights advantageously. Data visualization is a key to distilling overwhelming amounts of information in a universal visual language. A dynamic merger of art and science, in which creative design is as important as information, data visualization has continued to evolve and now includes motion and interactive technology. Done right, data visualization improves productivity, training, analysis, operations, financial management, marketing, and customer relationships, enhancing return on investment for those who take advantage of its power to communicate.
Data visualization rapidly conveys information in a universally understood way. You can train staff faster and better, share information clearly and succinctly, and easily gain insights from massive amounts of data. From pinpointing areas of improvement to more accurately predicting sales, data visualization is a key to mastering, not being crushed by, mountains of information.

Making the Most of Data Visualization
How data is presented is as important as the data itself, to make the data understood, and to have the impact it needs. Categorizing information visually, ordering data elements with the proper flow, and high-impact graphics are just some elements to ensure that your data presentations consistently and clearly transmit your messages and calls to action.
The goal of innovative data visualization is to make complex data understandable. Whether summarizing massive amounts of information, explaining a multifaceted process, or educating, empowering, or providing staff with a new perspective, data visualization is an increasingly essential element, and best done by those with experience and deep knowledge.

Data Visualization in 2019
Enter data visualization 2019. Simply explained, data visualization is presenting data formatted pictorially or graphically with the goal of enabling humans to understand the rising tide of never-ending data and use it advantageously. Today, data visualization is key to utilizing vast amounts of data successfully in the corporate world. A dynamic merger of art and science, data visualization continues to evolve into an interactive technology that promises to improve business/customer relationships and enhance return on investment (ROI) for those who invest now.
There is no doubt that the charts, graphs, and pictures of data visualization can convey information and concepts universally and easily understood than the traditional reports and spreadsheets of the corporate world. For businesses, data visualization means not only better communication with customers, but also understanding what influences customer behavior, enhancing product placement, pinpointing areas for improvement, accurately predicting sales, and more.
